
Every kitchen retailer we’ve ever worked with knows that some parts of their local market are more fruitful than others.
You’ll know the towns, villages, suburbs and postcodes that have historically produced more projects, higher average order values or simply more of the type of customer you want to attract.
And you’ll almost certainly have a good idea where the more affluent pockets of your market are.
That’s important because, when you’re selling a high-ticket product like a premium kitchen, not every part of your catchment area offers the same potential.
So, it makes little sense to spread your marketing investment evenly across a 10, 15, or 20-mile radius, as if it did.
The question is, how accurately can you identify the areas where that investment is best focused?
Your own experience and local knowledge are a great starting point. But what if you could go much further – narrowing your market down in far greater detail and putting hard data behind what you already know?
You can.
As a progressive marketing agency, we invest thousands of pounds every month in dozens of digital marketing tools, technologies and platforms – constantly looking for ways to sharpen what we do and get more from every pound our clients invest.
But one of our favourite tools is absolutely free.
We use it week in, week out when planning and fine-tuning the geographical focus of our kitchen clients’ marketing.
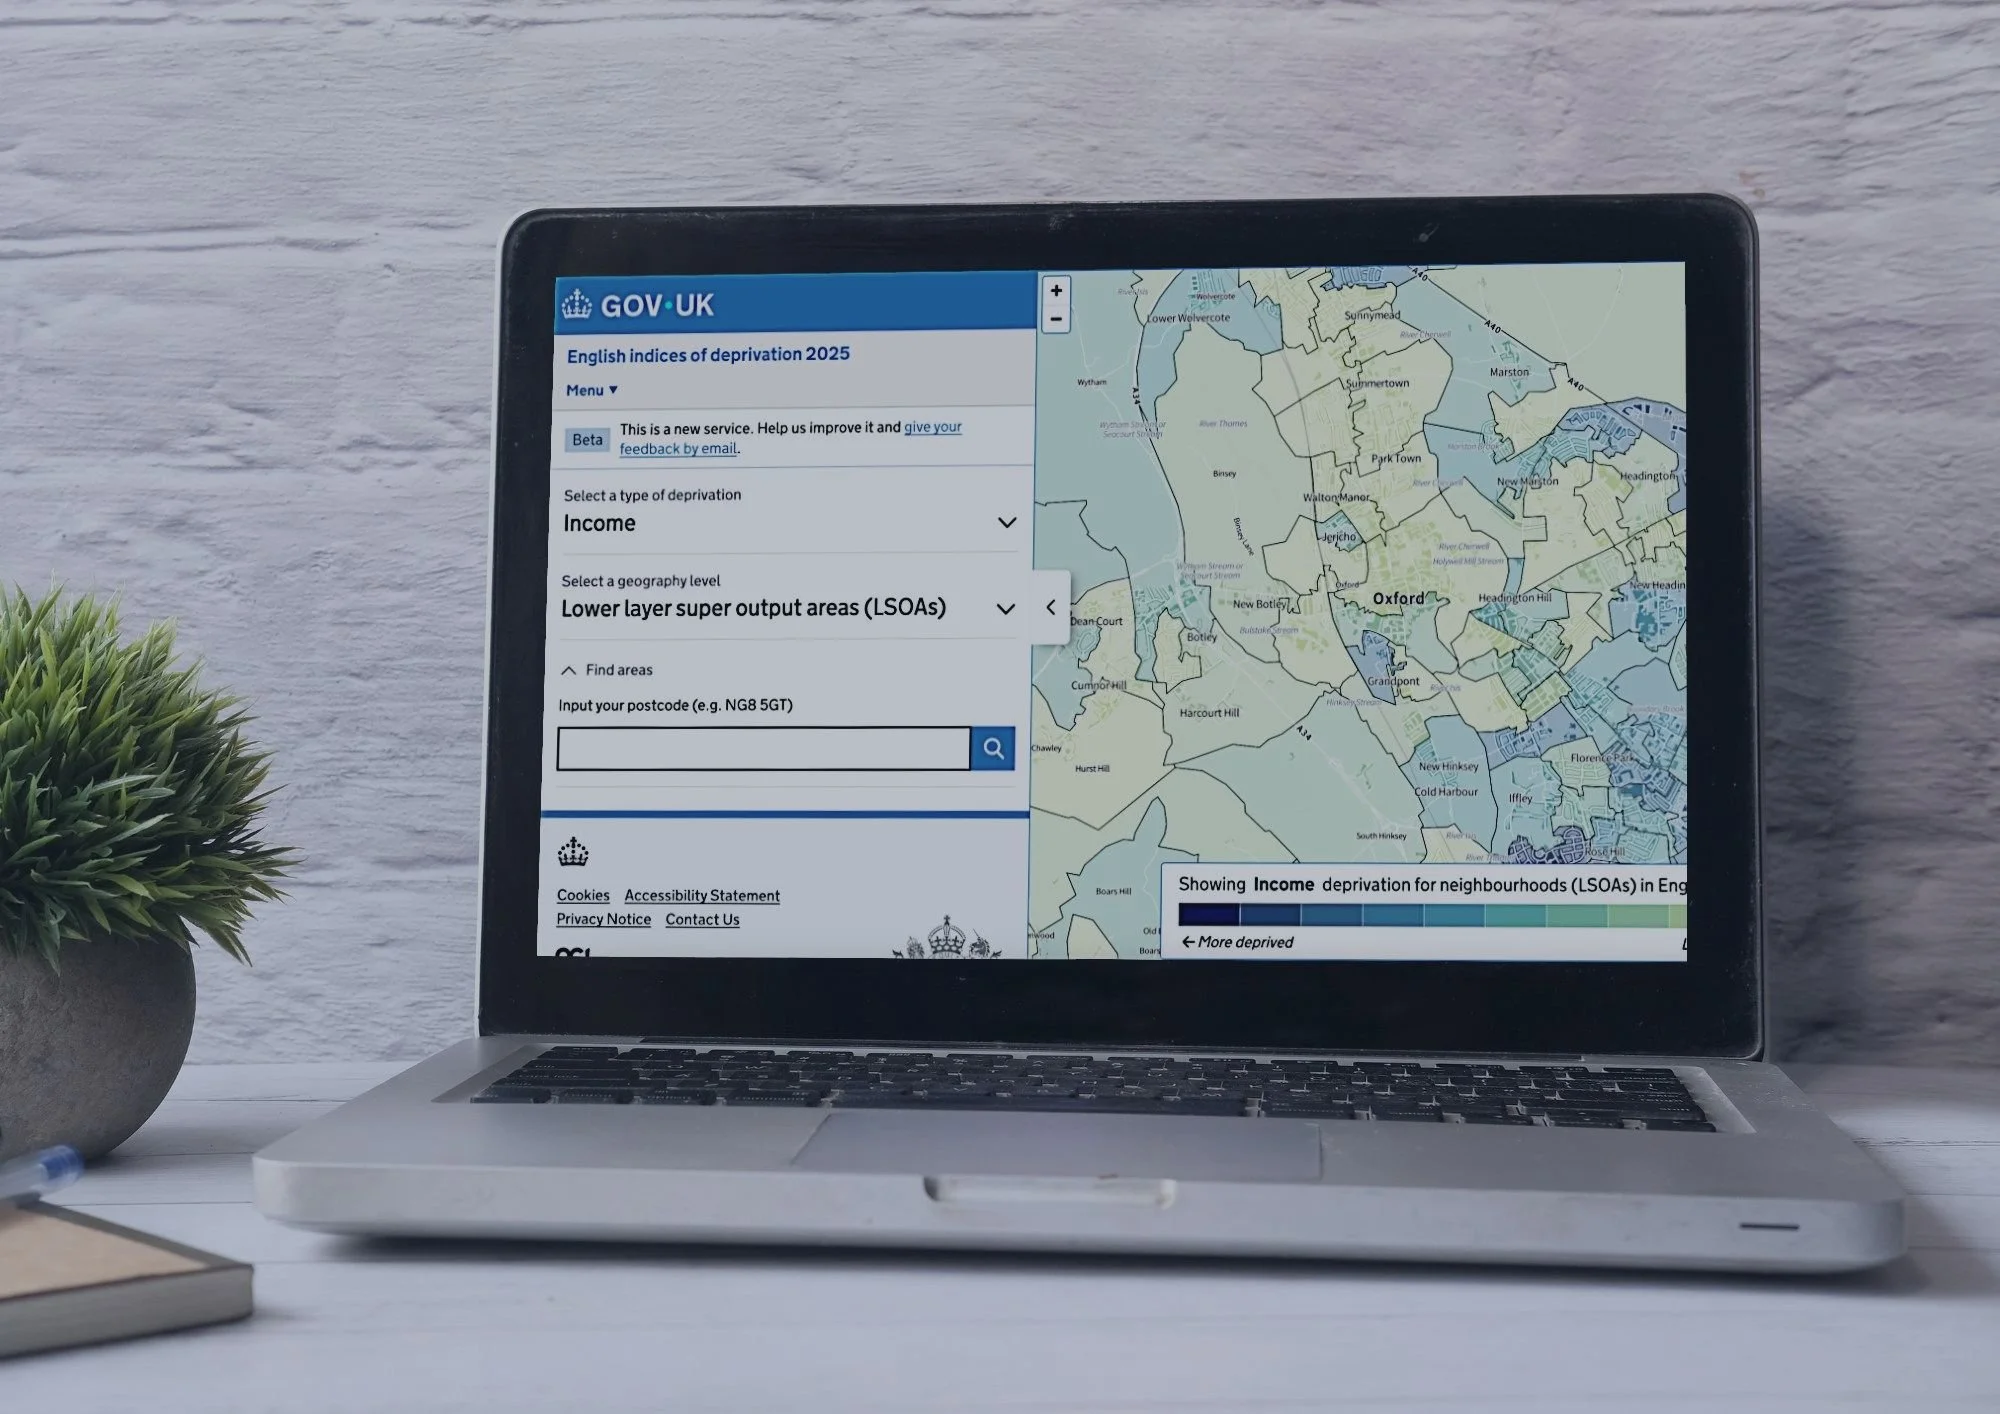
It’s the Government’s deprivation mapping data.
Among other things, it allows you to drill down into income data for different areas of the country – including your own local market – and build a remarkably detailed picture of where income levels are higher and lower.
So rather than relying on broad assumptions about the affluence of a particular town, village or postcode, you can go much deeper. You can identify the individual pockets within your catchment area where income levels are higher.
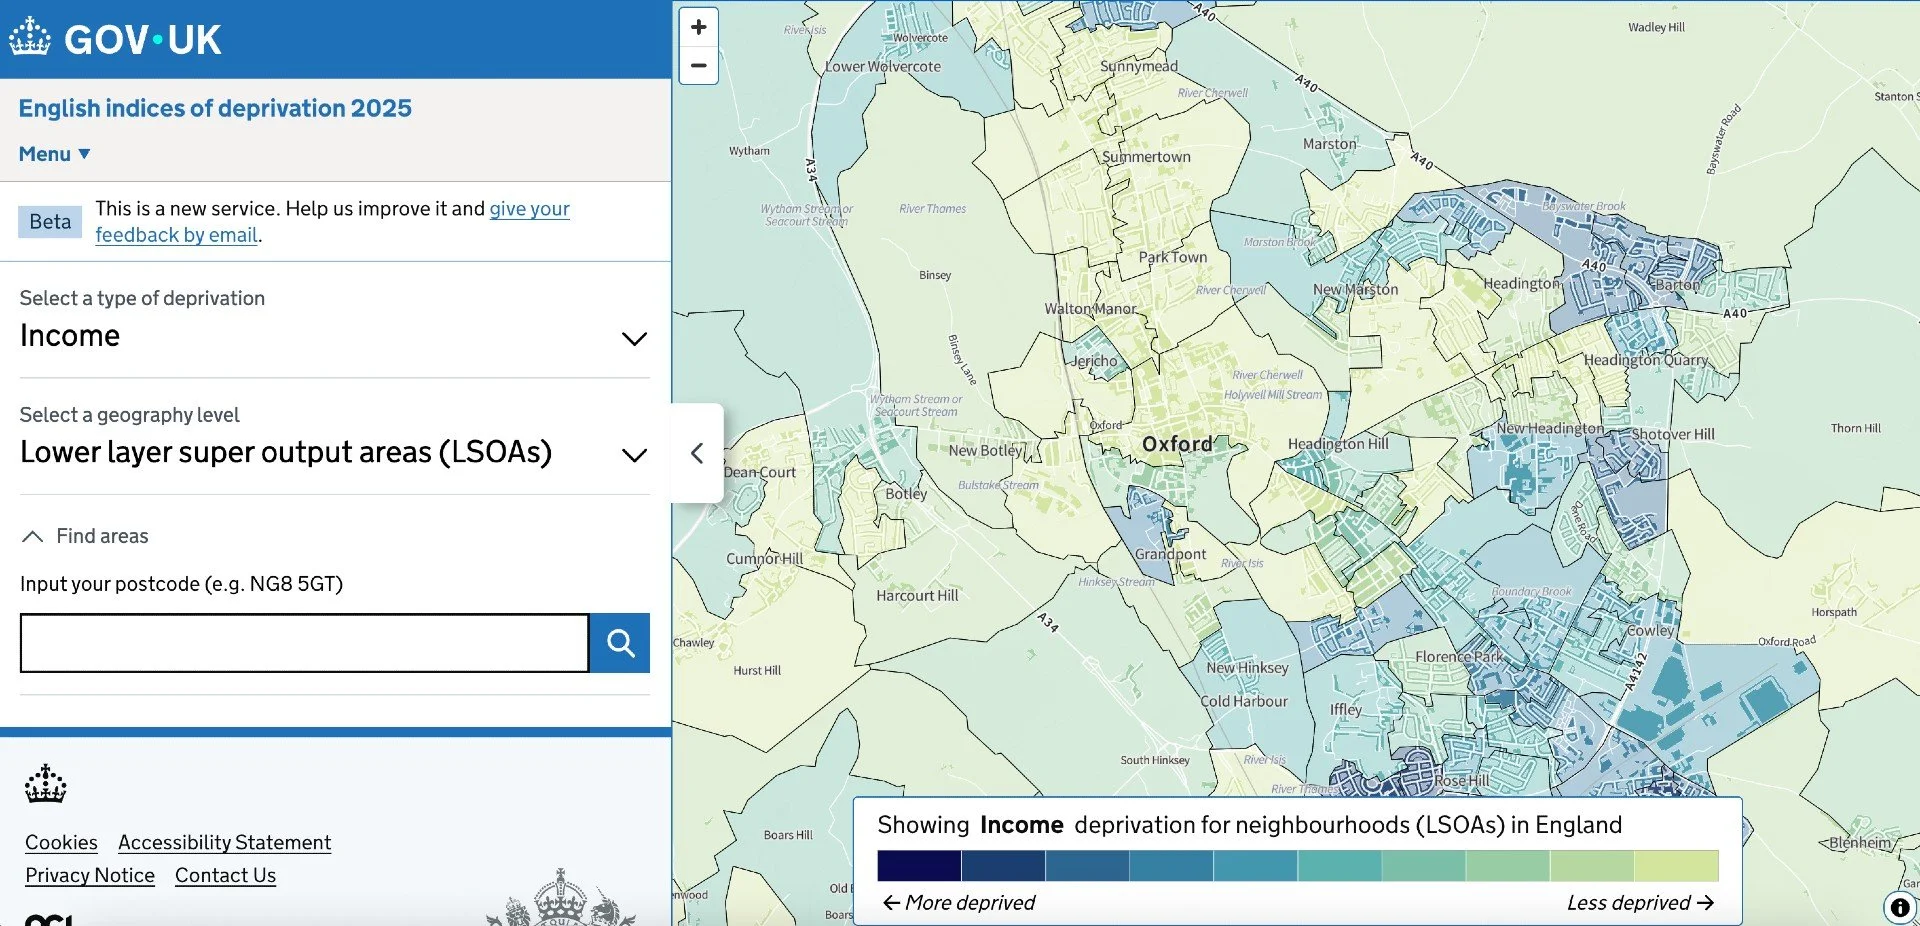
This is all about targeting.
We use the data alongside what we already know about a client’s market to weight marketing spend towards areas with higher income levels and greater potential – all to get better bang for their buck.
You can’t necessarily target your digital advertising street by street. But this level of insight can help you identify the areas that warrant greater focus – and those where the same marketing pound may be better spent elsewhere.
And because the data is publicly available, you can explore your own market for yourself:
England: Explore the Income Deprivation Map
Northern Ireland: Explore the Northern Ireland Deprivation Measures
Take a look at your own catchment area. You’ll likely be surprised by what you discover about the market on your doorstep.
And even if it simply confirms what you already suspected, you can make those marketing decisions supported by actual data rather than instinct alone.